- Documentation
- Getting Started
- JArchitect Analysis
- JArchitect Plugin for Sonar
- Code Rule and Query
- JArchitect Features
- Build Process Integration
- Code Metrics Definitions
- Code Coverage FAQ
- Trend Monitoring
Visualizing Code Metrics with Treemap
Introduction
In the Metric View, the code base is represented through a Treemap. Treemapping is a method for displaying tree-structured data by using nested rectangles. The tree structure used in JArchitect treemap is the usual code hierarchy:
- Java projects contain packages,
- Packages contain types,
- Types contains methods and fields.
The option Code Metric of the treemap determines the size of rectangles. For example if level is set to type and metric is set to number of Lines of Code, each unit rectangle represents a type, and the size of a unit rectangle is proportional to the number of Lines of Code of the corresponding type.
If a CQLinq query is currently edited, the set of code elements matched by the query is shown on the treemap as a set of blue rectangles. In the screenshot below, a CQLinq query matches the 200 largest methods. Here the treemap level is method and the metric is number of lines of code. As expected, we can see that blue rectangles represent the 200 largest unit rectangles of the treemap.
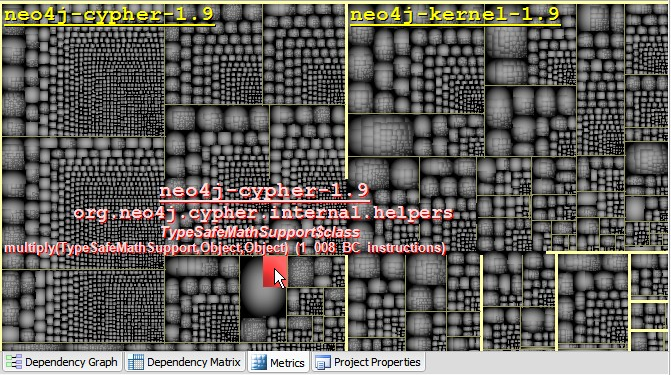
The screenshot below also shows that the currently pointed code element (here the project XML) is shown as a red rectangles on the treemap.
Common Scenarios
By choosing an appropriate combination of metric and level values, the Metric View helps see patterns that would be hard to spot with other ways.
Too Big, Too Complex
JArchitect provides many code metrics to spot too big and too complex code. Method with too many parameters, too many variables, too many lines of code, too high cyclomatic complexity etc... should be banished. The same way types with too many lines of code should be banished too.
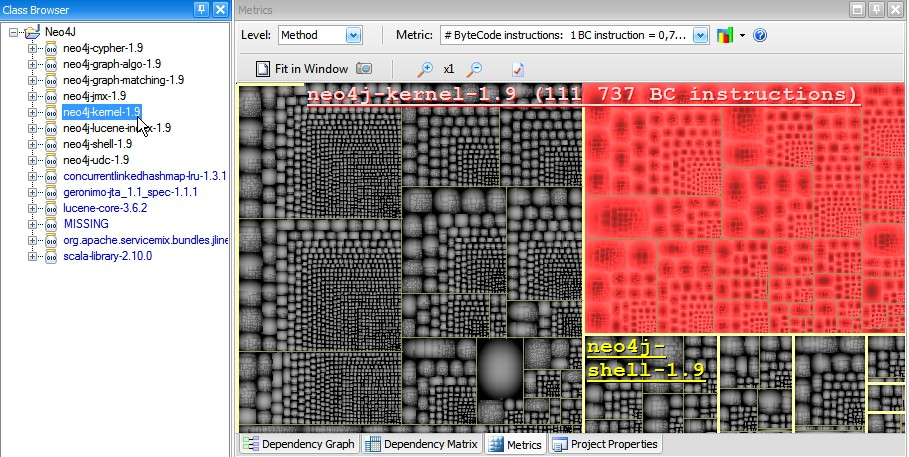
On the screenshot below, the treemap level is set to type and the metric is number of lines of code. Large rectangles represent large types of the code base. Hovering a rectangle with the mouse indicates the type metric values, here the type number of lines of code. Clearly, code treemaping helps not only spotting too large and too complex code elements, but also, it helps comparing their respective size and complexity.
Flaws Localization
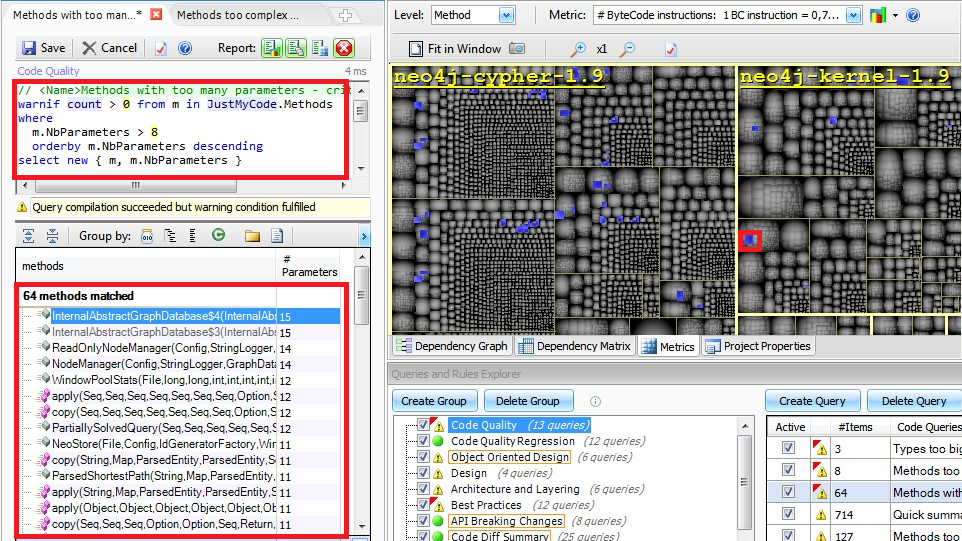
In the screenshot below we are asking with a CQLinq query, for methods with too many parameters and too many variables. Blue rectangles show matched methods on the treemap. Here the interesting point is that some matched methods seem to be grouped. Because treemap is a hierarchical view, if a set of code elements is grouped, it means that the code elements belong to the same parent. And indeed, here the 64 methods grouped belong to the same type.
Spotting the parent types of these 64 methods would have been hard without treemaping. Now the code quality reviewer can focus his attention on this region that seems to contain more flaws than other part of the code base.
Code Coverage Density
By using side-by-side the Search panel searching for code coverage ratio, and the Metric View, one can obtain some subtle information about how the code is covered by tests. In the screenshot below, we are asking throught the Search panel, for types 100% covered by tests. The Search panel is actually a CQLinq query generator. For example, the CQLinq query below is generated to ask for types 100% covered by tests.
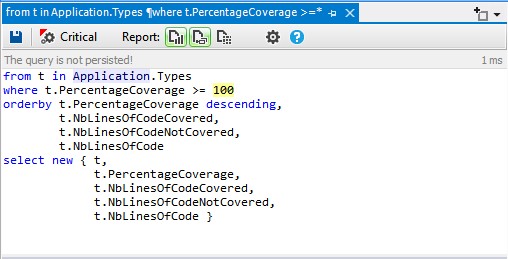
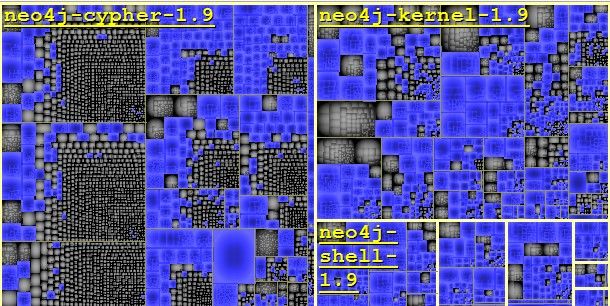
The blue rectangles on the treemap show all types 100% covered by tests. By exploring this treemap, a wide range of information concerning code coverage can be inferred. For example, as expected the UI code is much less covered than framework code for example.
Top-Down Code Exploration
The JArchitect treemap metric view supports zoom-in and zoom-out. This makes easy to zoom on a particular project, namespace or class. This can be especially useful to explore and compare the volume of components in terms of lines of code.
By no mean productivity should be measured in terms of lines of code. However counting lines of code has been proven to be a useful metric to accurately estimate software, given a certain context of an organization. The code base features are somehow partitioned into assemblies, namespaces and types. With treemaping, these artifacts become rectangles that sit side-by-side. Rectangles areas, hence features weight, can be compared visually. Being able to periodically explore code size through treemaping is a unique way to build an accurate sense of feature weight and feature cost.
Do the experiment to visualize treemap on a code base you know well, and you'll be surprised to discover unexpected feature size.
Code Structure Observations
Choosing to use the Metric View with a metric different than volume (lines of code, number of parameters for methods...) or complexity, can reveal interesting observations.
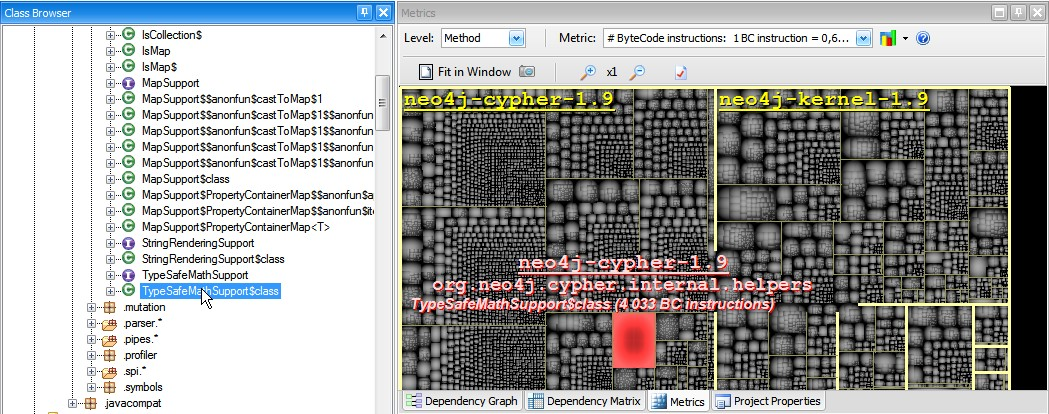
The ranking metric is a code metric that measure the popularity of a type or a method in a code base. Using treemaping with the ranking metric gives a clear view of where popular types are declared. This quickly gives information about what is important in the code base.
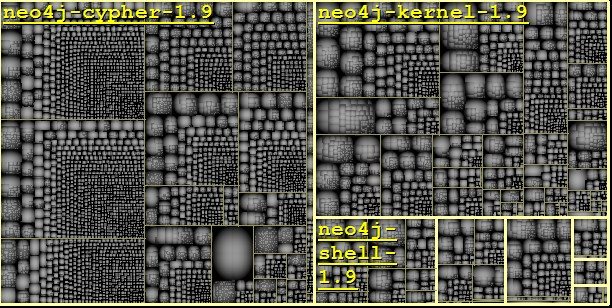
The screenshot below shows types of the neo4j code base treemaped with the ranking metric.
The same kind of interesting Code Structure Observations can be made with code metrics such as Afferent/Efferent coupling or Level.