
- Documentation
- Getting Started
- XClarify Analysis
- Code Rule and Query
- XClarify Features
- Build Process Integration
- Code Metrics Definitions
- Trend Monitoring
Customize XClarify Report
|
If you are new to XClarify reporting, before digging into report customization, it is recommended to:
|
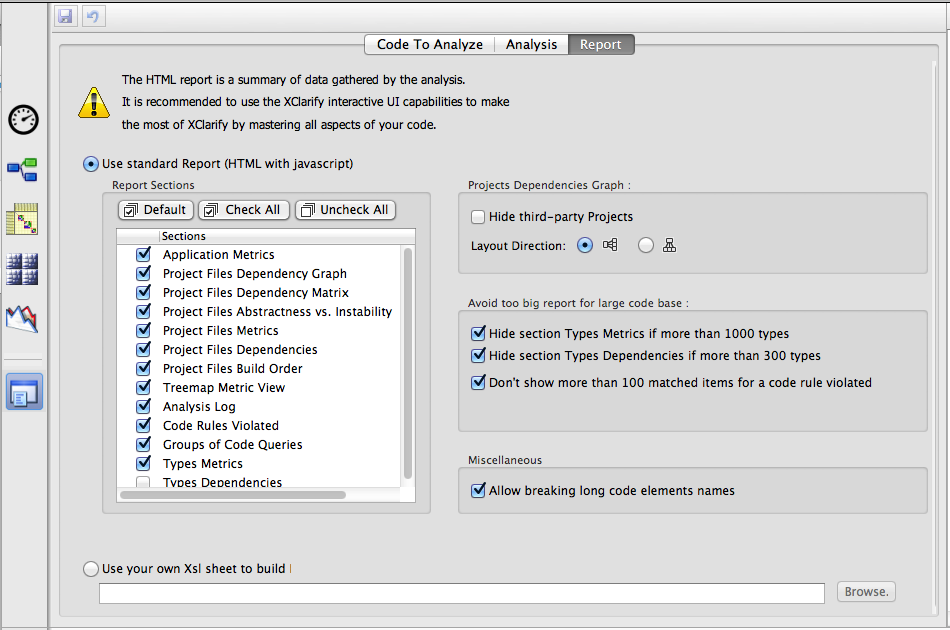
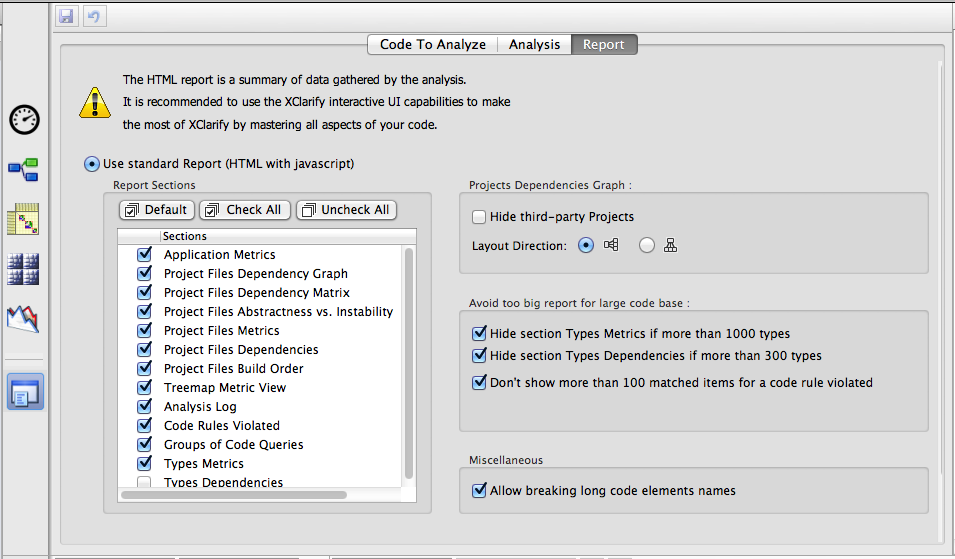
Report Sections
Report can be customized through the Report sub-panel. You can choose to activate many pre-defined sections like, Application and Projects metrics, some diagrams (dependencies, metrics, abstractness vs.instability…), CQLinq rules violation, and more.
Reporting Code Rules Violations
On the main page, the report contains a section titled Summary of CQLinq Rules violated.
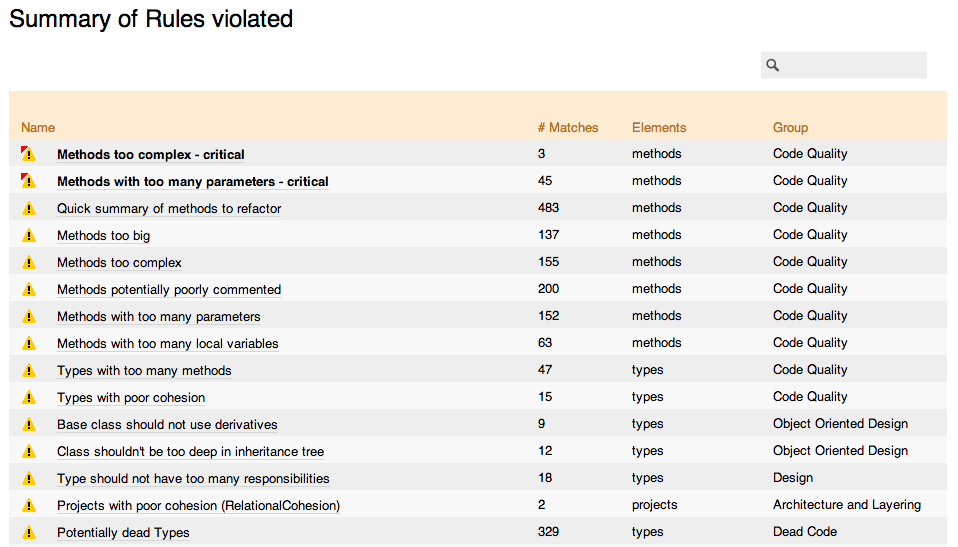
For each CQLinq rule you can choose whether you want to display violation in report (Active tickbox). In case of violation you can choose if you want to display list of items selected in report, statistics about this list of items, and a selection view of items selected. The fourth check button is related to making a CQLinq rule critical or not.
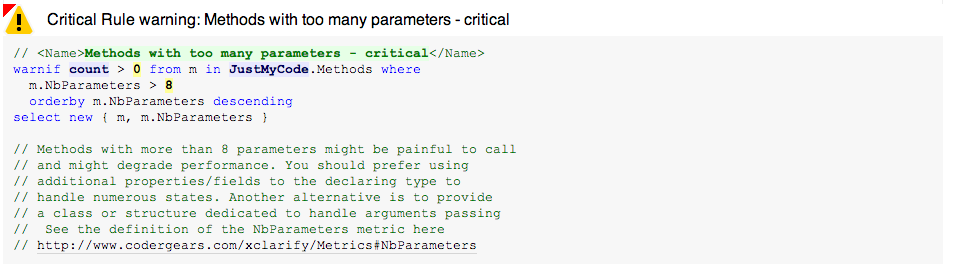
Here is what a CQLinq rule violated looks like in report:
Focusing on Recent Code Rules Violations
On a large legacy code base, XClarify will likely report thousands of code violations. XClarify proposes the possibility to focus only on recent code rules violations. Only violations that occur on code elements added or refactored since the baseline for comparison will be reported.
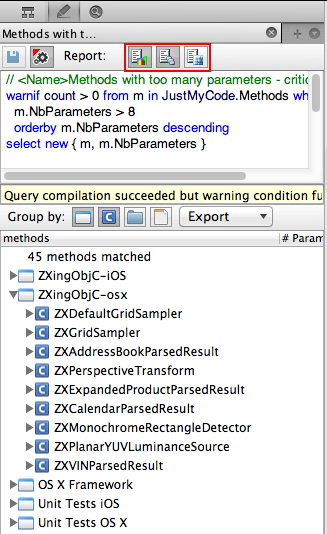
Reporting groups of CQLinq Queries
Reporting the set of rules violated is useful, but it is also interesting to report some result sets of a few CQLinq queries. For example, you might want to write CQLinq queries to ask for methods and types added or refactored since the last release. And you might want to list these methods and types added or refactored in the report.
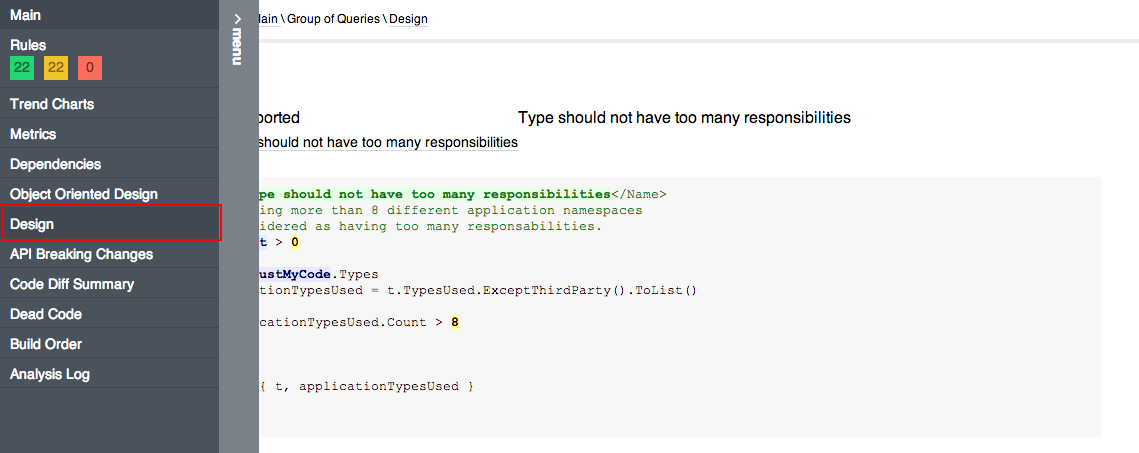
To do so, XClarify make possible to append extra report sections that lists these CQLinq queries. In the CQLinq Query Explorer panel, a particular CQLinq group reported is bordered with an orange rectangle.
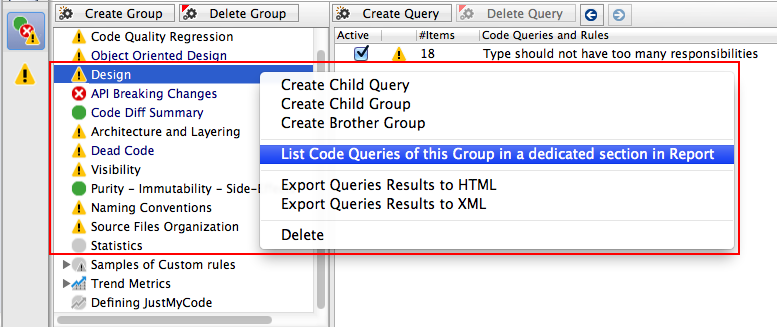
And here are the extra report sections:
Avoiding too large report
It is recommended to de-activate the Type Metrics and Type Dependencies sections since they can become pretty large if you have more than a thousand types in your application. Typically, browsing type metrics and dependencies is a scenario better addressed through the interactive UI.
By default, XClarify sets a few flags on Project Properties to avoid too large reports:
Report Xml files
You can choose to build your own customized report by providing your own XSL sheet. It can be inspired from the one in $XClarify Install Dir$/BuildProcessResources/ReportXsl/XClarifyReport.xsl. Input information can be taken from the following XML files outputted by the analysis in the $AnalysisOutputDir$\XmlFilesUsedToBuildReport folder:
- ApplicationMetrics.xml
- Dashboard.xml
- ProjectsBuildOrder.xml
- ProjectsDependencies.xml
- ProjectsMetrics.xml
- TypesDependencies.xml
- TypesMetrics.xml
- InfoWarnings.xml
- CodeRuleResult.xml
- CodeRuleCriticalResult.xml
- CodeQueryResult.xml
The tickbox XClarify Keep XML files used to build reports and store warnings must be ticked, else these XML files get deleted by XClarify after the report is built.