- Documentation
- Getting Started
- XClarify Analysis
- Code Rule and Query
- XClarify Features
- Build Process Integration
- Code Metrics Definitions
- Trend Monitoring
Exploring Existing Code Architecture
Thanks to the collaboration of...
- An interactive Dependency Graph,
- A Dependency Structure Matrix,
- Interactive Code Querying possibilities,
- Dependency Graph
- Call Graph
- Class Inheritance Graph
- Coupling Graph
- Path Graph
- All Paths Graph
- Cycle Graph
- Large Graph visualized with Dependency Structure Matrix
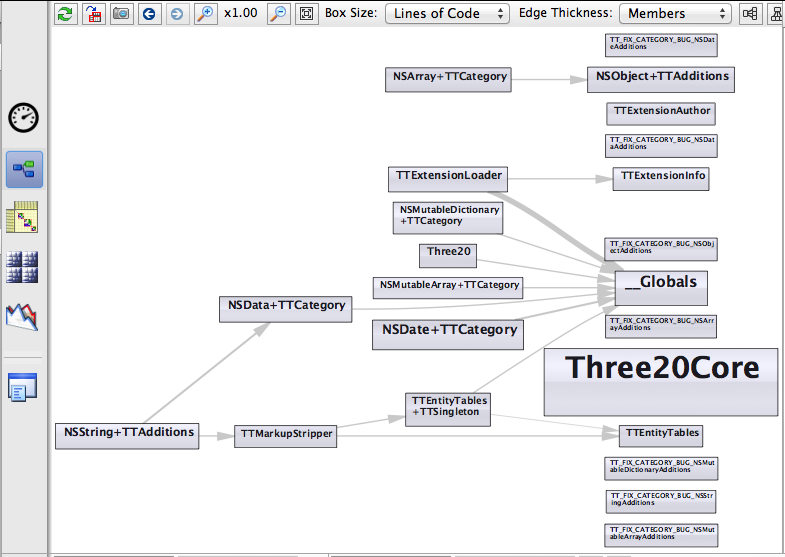
Dependency Graph
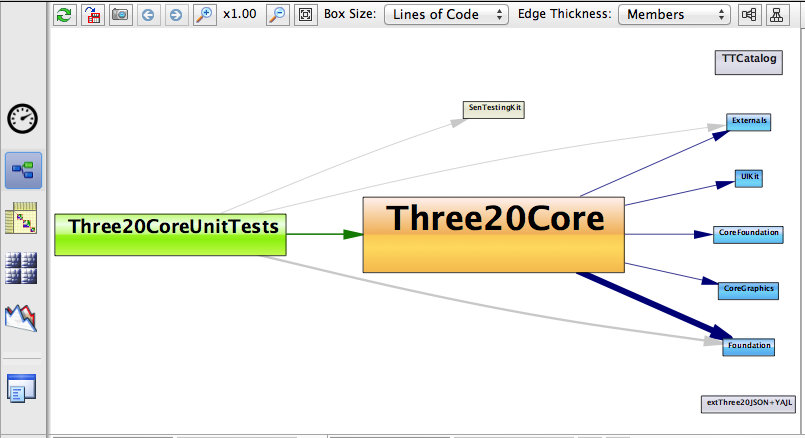
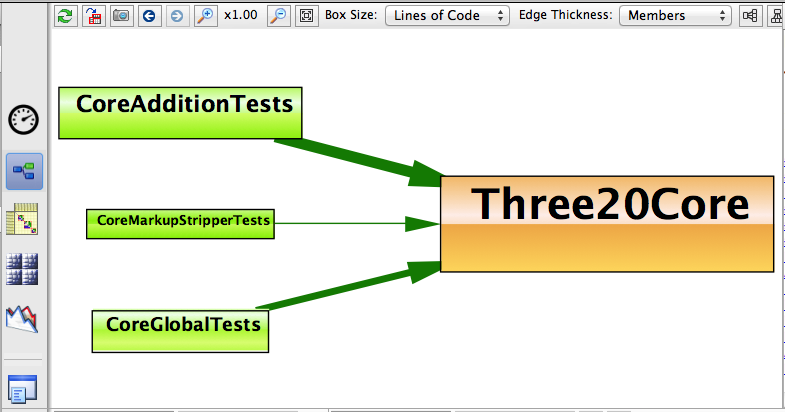
By default, the XClarify dependency graph panel displays the graph of dependencies between projects:
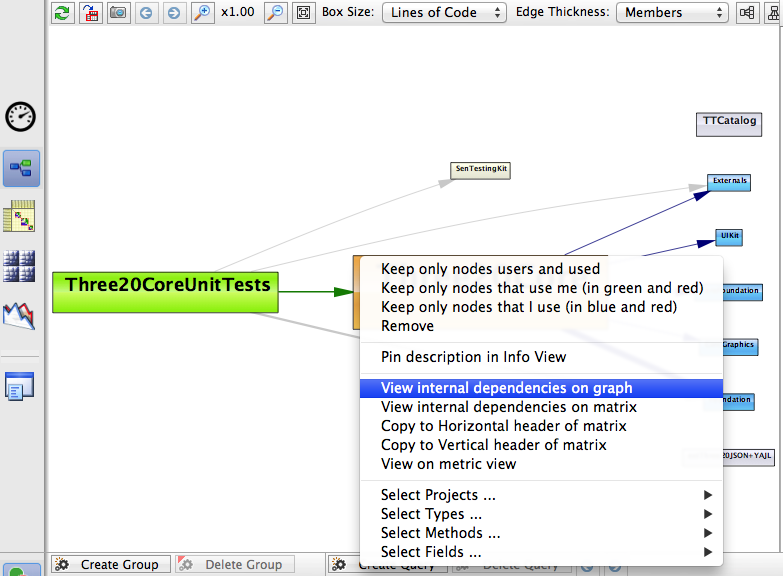
You can choose a project, right-click menu,and XClarify proposes to explore the graph of dependencies.
And for each member, XClarify proposes to explore the graph of dependencies between types of a member.
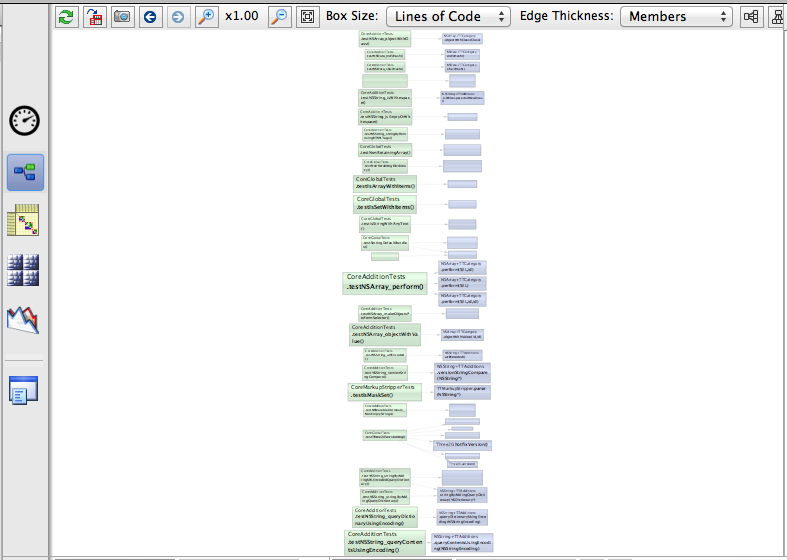
And by right-click menu, XClarify proposes to explore the graph of dependencies between members (methods + fields) of a type.
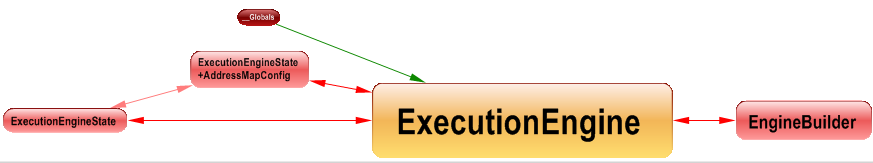
Call Graph
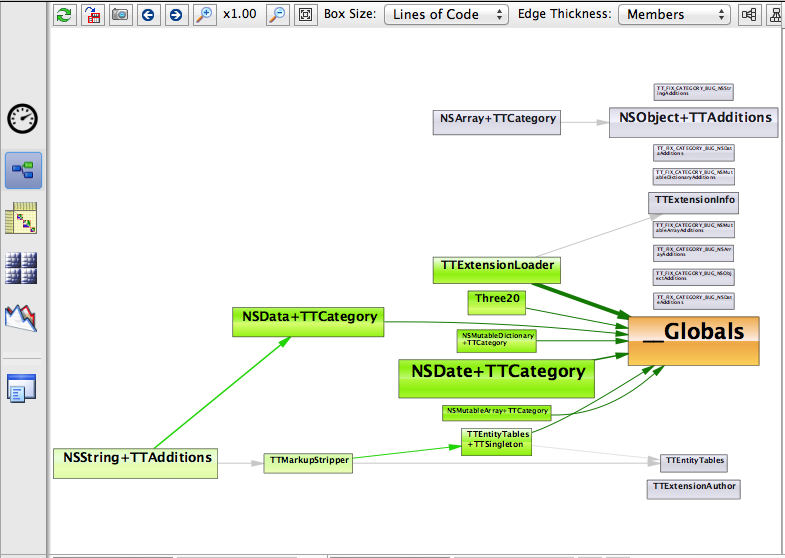
XClarify can generate any call graph you might need with a two steps procedure.
-
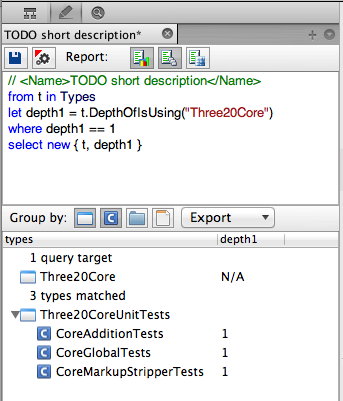
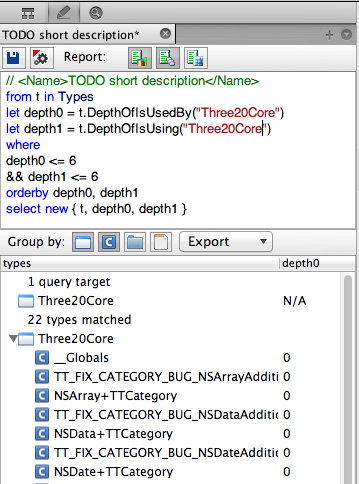
First: Ask for direct and indirect callers/callees of a type, a field, a method, or a project.
The effect is that the following CQLinq query is generated to match all callers or callees asked.
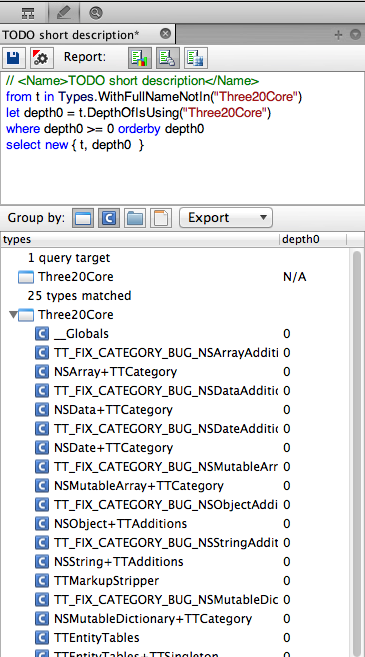
Notice that, in the CQLinq query result, the metric DepthOfIsUsing/DepthOfIsUsedBy shows depth of usage (1 means direct, 2 means using a direct user etc...). The CQLinq query can easily be modified to only match indirect callers/callees with a certain condition on depth of usage.
Notice also that callers/callees asked are not necessarily of the same kind of the concerned code element. For example here we ask for methods that are using directly or indirectly a type.
-
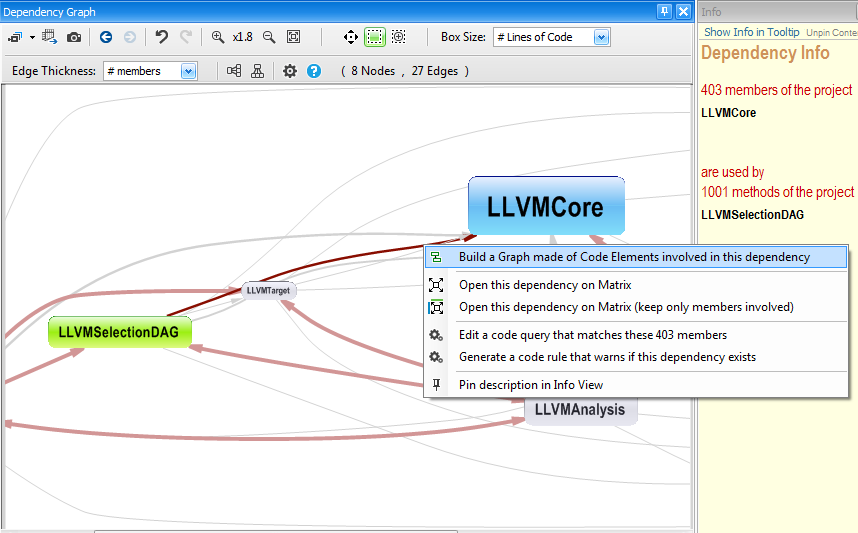
Second: Once the CQLinq query matches the set of callers/callees that the user wishes, the set of matches result can be exported to the Dependency Graph.
This has for effect to show the call graph wished.

Class Inheritance Graph
To display a Class of Inheritance Graph, the same two steps procedure shown in the precedent section (on generating a Call Graph) must be applied.
-
First: Generate a CQLinq query asking for the set of classes that inherits from a particular class (or that implement a particular interface).
Here, the following CQLinq query is generated:
-
Second: Export the result of the CQLinq query to the Dependency Graph to show the inheritance graph wished.
Coupling Graph
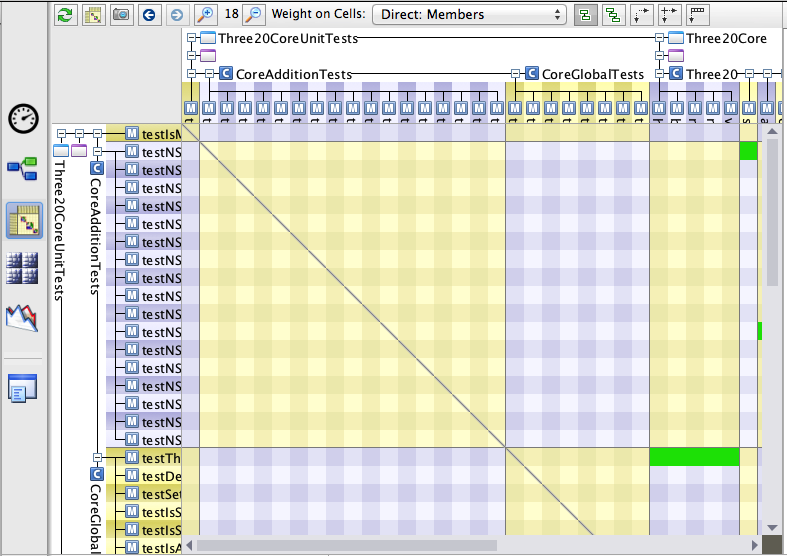
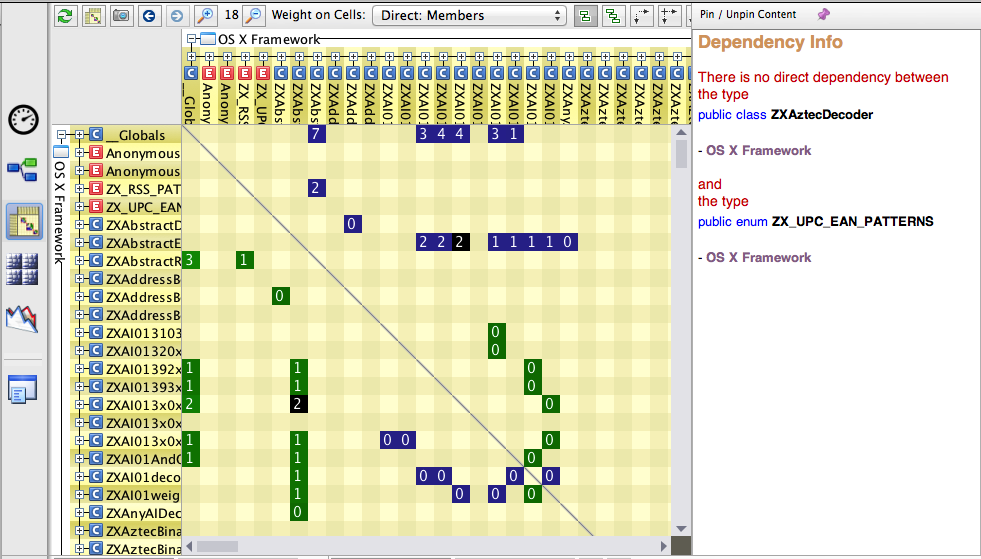
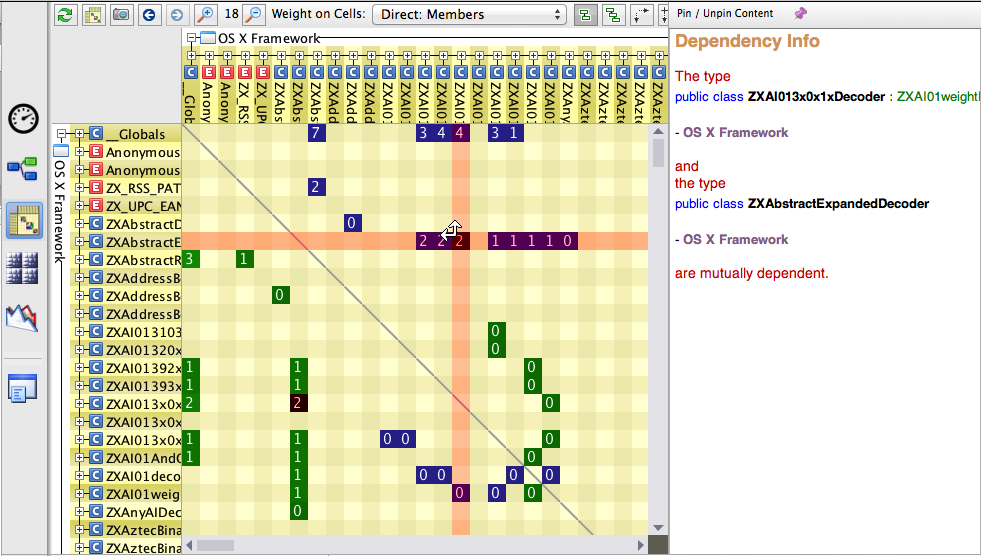
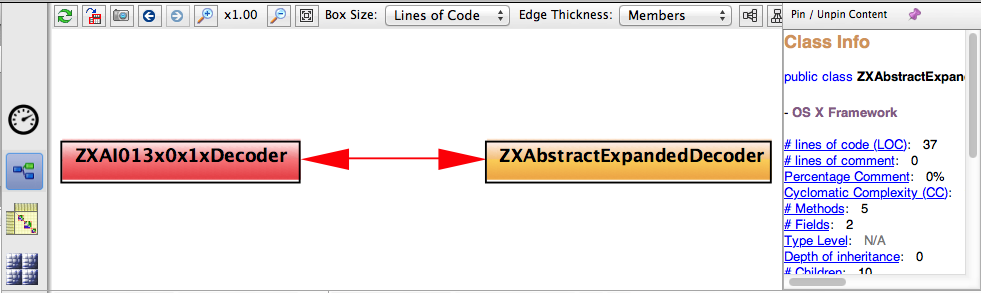
It might be needed to know which code elements exactly are involved in a particular dependency. Especially when one needs to anticipate the impact of a structural change. In the screenshoot below, the XClarify Info panel describes a coupling between 2 projects.
From pointing a cell in the dependency matrix, it says that X types of an project A are using Y types of an project B. Notice that you can change the option Weight on Cell to # methods, or # members, if you need to know the coupling with something else than types.
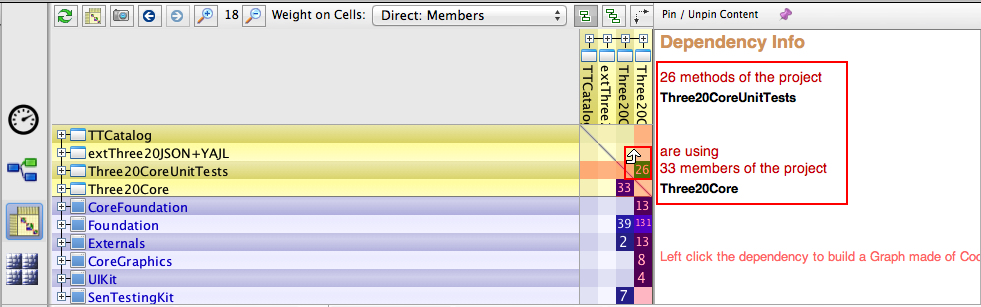
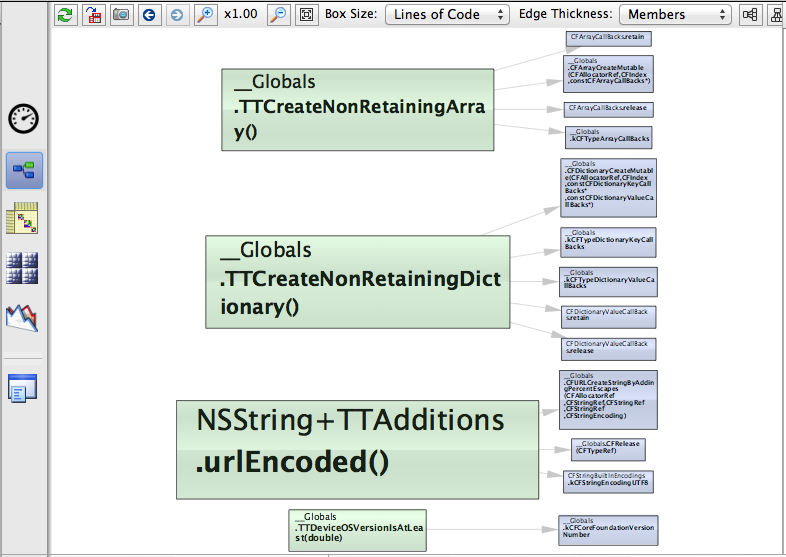
Just left clicking the matrix cell shows the coupling graph below.
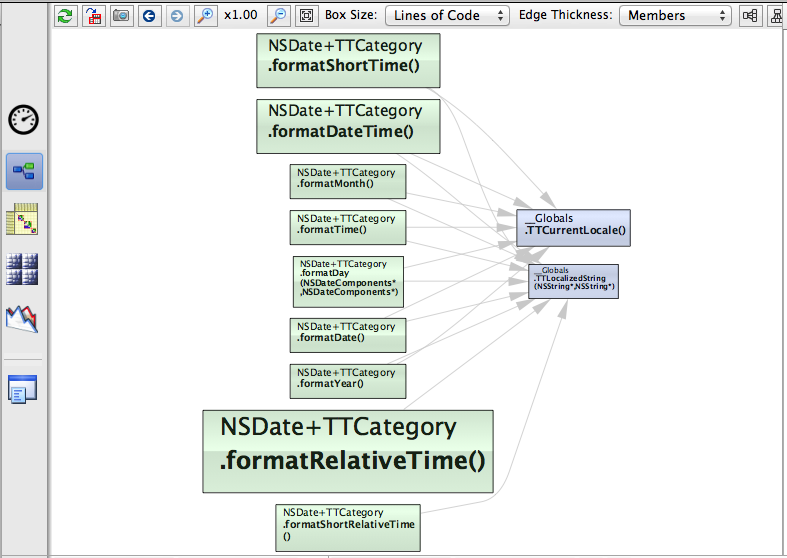
A coupling graph can also be generated from an edge in the dependency graph. Here, you can adjust the option Edge Thickness to something else than # type.
Path Graph
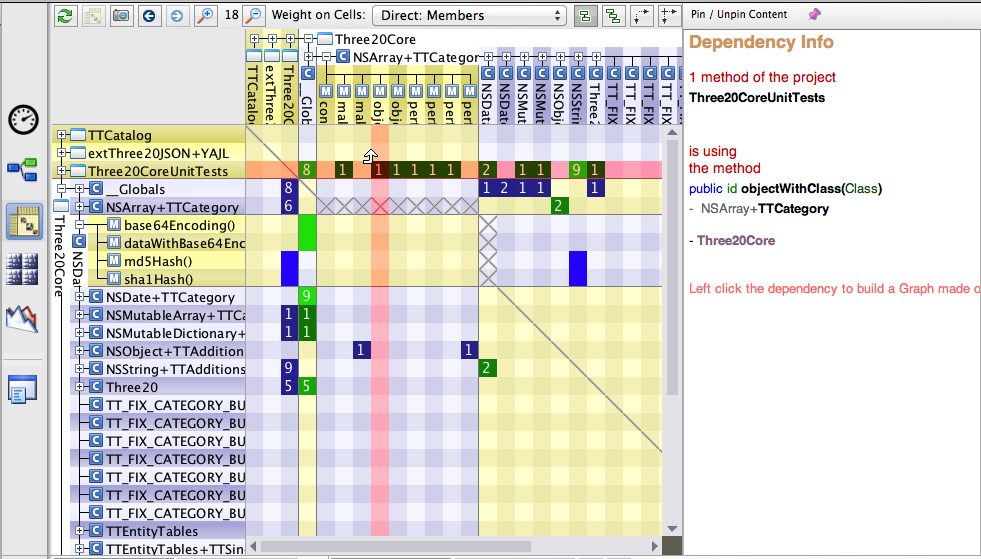
If you wish to dig into a path or a dependency cycle between 2 code elements, the first thing to do is to show the dependency matrix with the option Weight on Cells: Direct & indirect depth of use.
Matrix blue and green cells will represent paths while black cells will represent dependency cycles.
Just left clicking the cell shows the path graph below.
All Paths Graph
In certain situations, you'll need to know about all paths from a code element A to a code element B. For example, here, the Info panel tells us that there is a path of minimal length 2 between the 2 types involved.
Finally exporting to the graph the types matched by the CQLinq query, shows all paths from A to B.
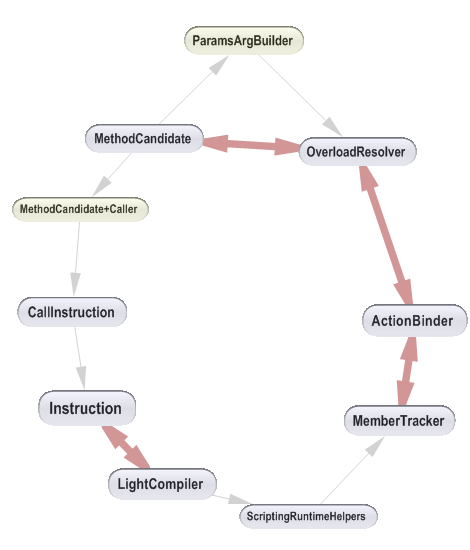
Cycle Graph
As we explained in the previous section, to deal with dependency cycle graphs, the first thing to do is to show the dependency matrix with the option Weight on Cells: Direct & indirect depth of use. Black cells then represent cycles.
For example, here, the Info panel tells us that there is a dependency cycle of minimal length 2 between the 2 types involved.
Just left clicking the cell shows the cycle graph below.
We'd like to warn that obtaining a clean dependency cycle as the one shown above, is actually more an exceptional situation than a rule.
You'll see that some edges will be counted more than once.
Large Graph visualized with Dependency Structure Matrix
Here, we'd like to underline the fact that when the dependency Graph becomes unreadable, it is worth switching to the dependency Matrix.
Both dependency Graph and dependency Matrix co-exist because:
- Dependency Graph is intuitive but becomes unreadable as soon as there are too many edges between nodes.
- Dependency Matrix requires time to be understood, but once mastered, you'll see that the Dependency Matrix is much more efficient than the Dependency Graph to explore an existing architecture.