- Documentation
- Getting Started
- XClarify Analysis
- Code Rule and Query
- XClarify Features
- Build Process Integration
- Code Metrics Definitions
- Trend Monitoring
Trend Monitoring
Introduction
XClarify lets create trend charts. Trend charts are made of trend metrics values logged over time at analysis time. More than 50 trend metrics are available per default and it is easy to create your own trend metrics.
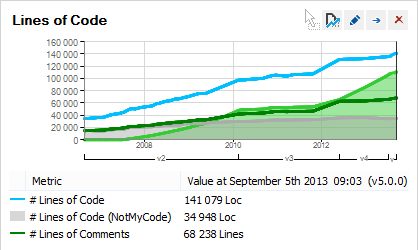
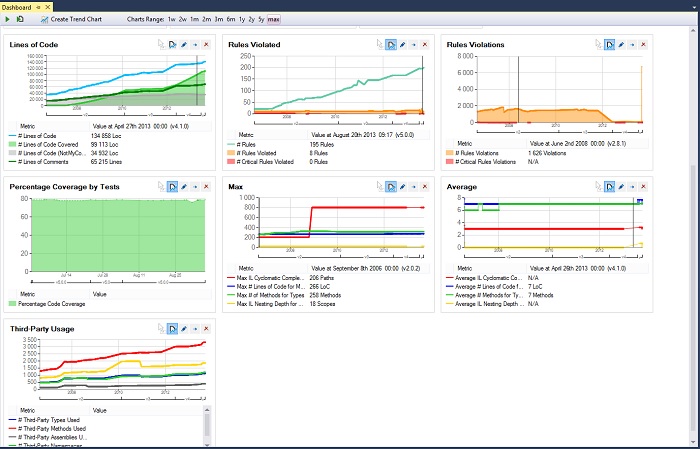
Trend charts are displayed on the XClarify dahsboard. Some trend charts are available per default to show:
- Lines of Code
- Number of Code Rules Violated and number of Code Rules Violations
- Max and Average values for various Code Quality Metrics
- Third-Party Usage
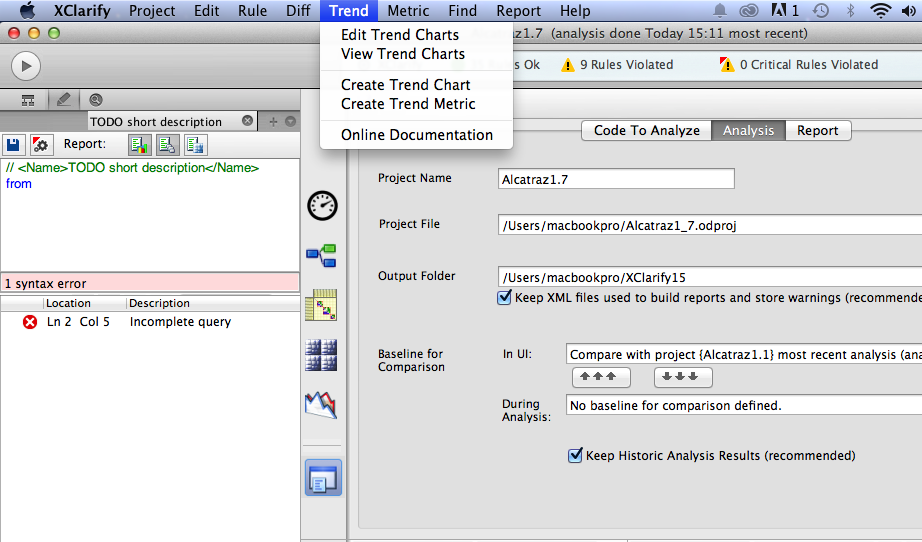
For all trending related operations, a trend menu is available.
Trend Metrics
To list the default trend metrics, look at the Queries and Rules Explorer panel and select the group named Trend Metrics.
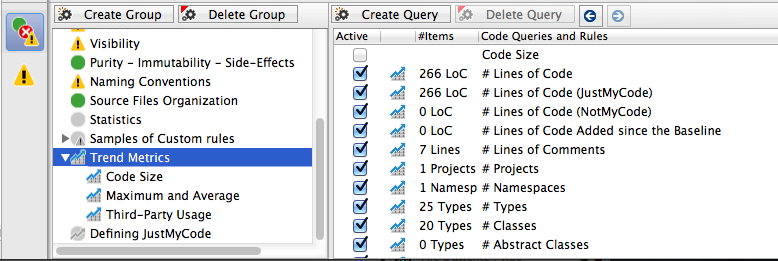
If trend metrics are listed in the code queries panel, it is because a trend metric is a CQLinq code query. It is a particular code query:
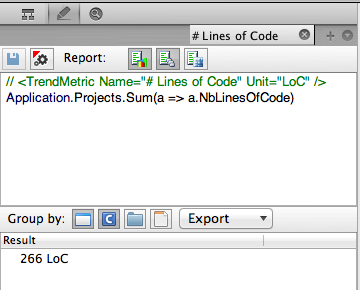
- A trend metric is a code query that returns a scalar. Hence trend metrics query often use LINQ aggregate operators that returns a scalar. This includes operators like Count() Sum() Average() Min() Max() ...
- The header of a code query is a comment line formatted this way // <TrendMetric Name="Metric Name" Unit="Metric Unit Name" />
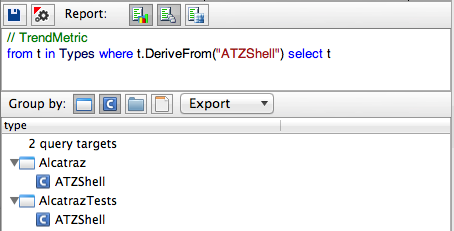
Since a trend metric is a code query, it is easy to create your own trend metrics or modify existing ones. For example here is a code query that counts the numbers of types inherenting from ATZShell:
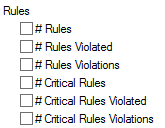
There are six default trend metrics that are not code queries. They relates to the number of code rules violates and the number of code rules violations:
Trend metrics are logged at analysis time as explained in the section Logging Trend Metrics.
Trend Charts
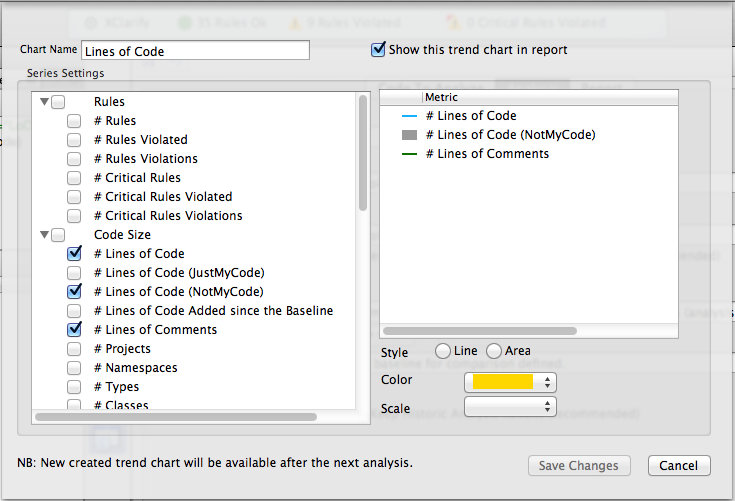
The Create or Edit trend charts dialog lets define all trend charts properties. The list of trend metrics series is available and checking a serie lets visualize it on the trend chart. A serie appearance can be customized, this includes:
- The color of the serie
- If the serie is displayed as a line or as an area
- Defining the serie scale. The scale setting is useful to adjust several series scales to compare them on the same trend chart.